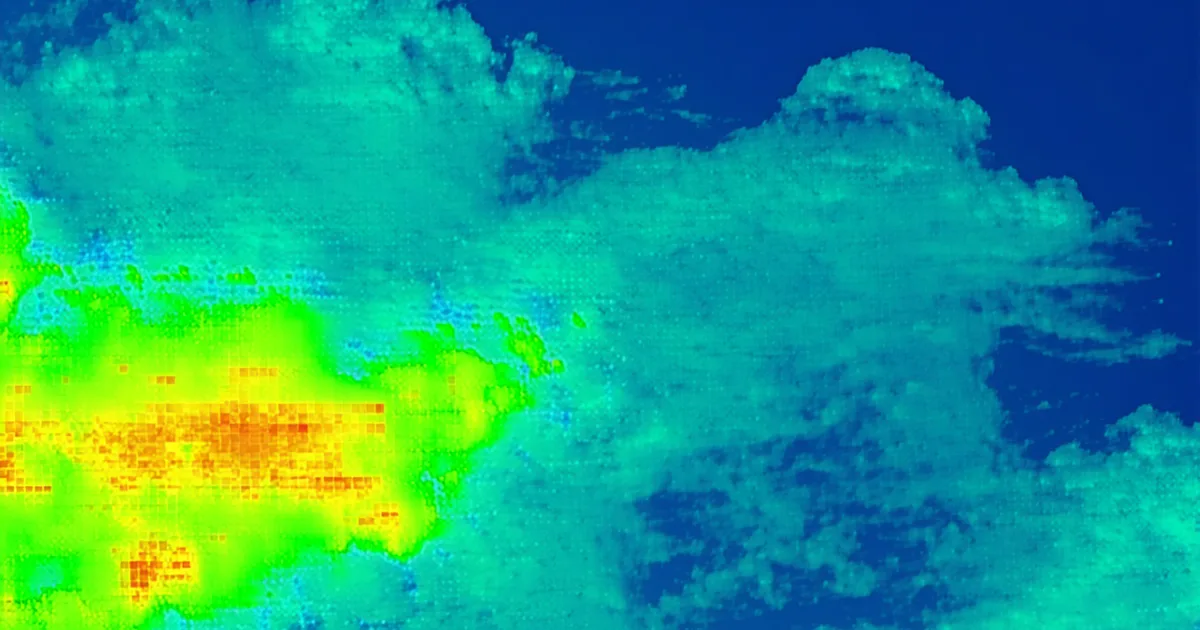
On a clear summer afternoon, a distribution feeder in the Mountain West with 40 MW of behind-the-meter solar generation looks radically different from the same feeder in 1999. Net load at the substation is a fraction of what it was. But on a day with convective cloud buildup in the early afternoon, that net load can swing 12 to 15 MW within 30 minutes as clouds pass over distributed rooftop arrays. That swing is not captured well by traditional temperature-based load forecasting models, and it's becoming a significant source of dispatch error as solar penetration rises.
The solution is to incorporate solar irradiance forecasts directly into the load model, not as a correction factor applied after the fact, but as a primary input that propagates through the forecast and into dispatch decisions. This sounds straightforward. In practice, it requires working through several layers of data integration and uncertainty handling that are worth examining in detail.
What Irradiance Data Is Actually Available
There are several tiers of solar irradiance data, with very different latency, spatial resolution, and cost profiles.
Numerical weather prediction (NWP) models such as NOAA's HRRR (High-Resolution Rapid Refresh) provide irradiance forecasts as part of their broader atmospheric model output. HRRR runs hourly, produces forecasts out to 18 hours at 3 km spatial resolution, and is freely available. For distribution-level grid applications, 3 km resolution is often acceptable; behind-the-meter solar in an urban or suburban distribution territory will typically have a correlated irradiance signal at that scale, with exceptions for localized weather effects like coastal fog or orographic clouds that can produce significant spatial variability within 3 km.
Satellite-derived irradiance estimates, such as those from NOAA's GOES-R series processed through algorithms like the SolarAnywhere or Solargis datasets, provide near-real-time estimates with 15-minute or 30-minute update frequency and sub-kilometer spatial resolution. These are retrospective estimates rather than forecasts, but at 15-minute latency they're a valuable input for updating a nowcast model in real time, especially for cloud tracking and short-horizon (0-4 hour) irradiance prediction.
Ground-based pyranometer networks provide the highest quality irradiance measurements, but coverage is sparse. National networks like SURFRAD have a handful of stations nationwide. A distribution operator may have zero pyranometer sites within their territory. Ground-based data is useful for model validation and bias correction, but generally can't substitute for satellite or NWP data for operational forecasting.
The Spatial Aggregation Problem
A distribution territory with 40 MW of behind-the-meter solar doesn't have all that solar at a single point. It might be distributed across 8,000 rooftop installations at residential scale, plus several hundred commercial installations, spread over 200 square kilometers of service territory. When you want to predict the aggregate generation from that portfolio, you need to aggregate irradiance across the spatial distribution of the installations.
This matters because cloud events have spatial structure. A convective cloud cell might reduce irradiance by 80% over a 5 km area while leaving adjacent areas at full clear-sky irradiance. If your load model treats the entire distribution territory as a single irradiance point, you'll get the timing of cloud impacts wrong and your uncertainty estimates will be too narrow in the tails.
The practical approach we use is to segment the distribution territory into spatial clusters based on cloud correlation structure. Installations within a cluster tend to experience similar irradiance variation on sub-hour timescales. The number of clusters required depends on territory size and typical weather patterns. In a territory with primarily large frontal weather systems, one or two clusters may suffice. In a territory prone to convective afternoon thunderstorms with high spatial variability, you might need 5 to 10 clusters to avoid systematic aggregation error.
Cluster-level irradiance forecasts are then aggregated using the known installed capacity distribution across clusters to produce a territory-level solar generation forecast. That forecast, and critically its uncertainty distribution, feeds into the net load forecast.
Uncertainty Propagation
The part that requires the most care is propagating irradiance forecast uncertainty through to the dispatch decision. A point forecast of solar generation is not sufficient for dispatch optimization; you need the uncertainty distribution, particularly the probability of low-generation scenarios that would require battery dispatch or DR activation to compensate.
Irradiance forecast uncertainty has a specific structure. On clear days with stable atmospheric conditions, uncertainty is low, dominated by NWP model error. On days with significant cloud cover or convective instability, uncertainty is much higher and the distribution is asymmetric, with a hard floor at zero irradiance (clouds block all direct irradiance) and a ceiling at clear-sky irradiance. The distribution is not Gaussian, and treating it as such will underestimate the frequency and magnitude of large negative deviations from the mean forecast.
We found that a reasonable operational approximation is to use a beta distribution to model the irradiance uncertainty, parameterized by the NWP-forecast clear-sky index and a look-up table of historical forecast error standard deviations by clear-sky index and season. This is simpler than a full probabilistic NWP ensemble and sufficient for the decision-relevant risk quantiles (the 10th percentile scenario, where solar underperforms significantly, is what drives the reserve requirement).
When the 10th-percentile net load scenario exceeds what the dispatchable resource portfolio can serve with available battery and DR capacity, the system should flag the day ahead as high-risk and either pre-position additional resources or update the market commitment accordingly. This is the operational payoff from getting the uncertainty propagation right: you're not just forecasting the mean outcome, you're quantifying the tail risk that determines whether you have adequate dispatchable backup.
Real-Time Updating
Day-ahead irradiance forecasts are useful for resource planning. Real-time updating is essential for dispatch execution.
As the operating day progresses, two types of information become available: actual measured generation from behind-the-meter solar inverters (via AMI meter data or grid-connected inverter telemetry) and updated satellite-derived irradiance estimates. Both should feed into a running nowcast that replaces the NWP-based day-ahead forecast for the next 0-4 hour window.
Cloud tracking from satellite imagery is particularly valuable here. GOES-R imagery at 2.5-minute cadence allows tracking of individual cloud features as they move across a territory. A cloud cell approaching from the west can be detected 30 to 60 minutes before it begins to shade solar installations, giving the dispatch system a short but meaningful lead time to pre-position batteries or issue a demand response signal.
We're not saying satellite-based cloud tracking eliminates forecast error in the sub-hour horizon. Convective cloud development is inherently stochastic. But the expected value of having a 30-minute warning versus a 5-minute warning for a solar generation drop event is significant for a battery portfolio: at 30 minutes, you can begin pre-charging or staging batteries at a controlled ramp rate. At 5 minutes, you're reacting to an event that's already in progress.
Integration with the Load Forecast Model
Structurally, there are two ways to integrate solar irradiance into a distribution-level load model. The first is to forecast gross load (independent of solar) and forecast solar generation separately, then subtract to get net load. The second is to include irradiance directly as a feature in a net load model that was trained on historical net load data.
Both approaches have practical merits depending on data availability. If you have good AMI coverage and a long historical record of 15-minute net load at the substation level, training a net load model directly on that data with irradiance as a feature often produces good results, because the model learns the actual relationship between irradiance and net load for that specific territory, including effects like air conditioning load correlation with cloud cover that a pure generation model would miss.
If your behind-the-meter solar inventory is incomplete (you don't know exactly how much solar capacity is installed in the territory), the separation approach is more defensible. You forecast what you know from a generation model, and the residual uncertainty in your territory solar inventory shows up as a structured error that you can partially correct by observing substation net load in real time.
For most distribution operators we've worked through, the practical answer is a hybrid: a net load model trained on historical data for the base load component, with an explicit solar generation term that uses the irradiance integration methodology described above. This gives you interpretability and the ability to update the solar component independently as the installed capacity base grows, while capturing the correlation structure between weather variables and load that pure physical models miss.